facebook twitter youtube facebook facebook facebook

E-Mail : info@askmlabs.com

Phone : +1.215.353.8306

Latest Post
Showing posts with label trace. Show all posts

OEM LDAP Authentication Troubleshooting

Written By askMLabs on Wednesday, September 12, 2018 | 10:38 PM

In this post, we will discuss  troubleshooting OEM LDAP authentication issue. Due to various reasons, you may see sometimes the OEM users (LDAP users) getting Authentication failures. Well there could be various reasons for the authentication failures. We need to see how can we enable the tracing/debug to populate the detailed error messages in logs. The procedure is also explained in the Oracle Document.

Our troubleshooting started after users compaining about the authentication issues. We narrowed it with various testings/accessing other enterprise applications that the issue is only with the OEM. Now we have started our focus on troubleshooting authentication issue.

Check1 :

Check if the issue is with all the users ( Local and External ). If the issue is only with the External users(LDAP users), the primary focus of this post, Please proceed with the troubleshooting.

Knowing that the issue is only with the LDAP users, We focussed looking around the external ldap system. In our case, we are using Microsoft Active Directory to authenticate users to OEM.

Check2:

Check if the service account used to integrate for authentication is locked. The security/identity team in your Organization should be able to help you if the accout is locked or not. If the account is locked, Please have this account unlocked it. Verify if the issue is resolved.  But if the issue is not with the account locked, proceed to the next step to continue troubleshooting ….

Check3:

If the issue is not with the account locked, try enabling the Weblogic Debug/Tracing as described below ……

From the WebLogic Server Console, enable logging, set the WebLogic debug log level and then the enable the debug flag.

  1. Navigate to Environment->Servers->EMGC_OMS1 and choose the Logging tab.
  2. Under Rotation, set the file rotation size to 64000.
  3. Expand Advanced.
  4. Under Message destinations(s) (Log file: region) set the Severity level to Trace.
  5. Navigate to the Environment->Servers->EMGC_OMS1 and choose the Debug tab.
  6. Check WebLogic->security->atn->DebugSecurityAtn.
  7. Click Save.


Now these settings will create a logfile ldap_trace.logATN. This file ldap_trace.logATN is located at $OMS_HOME/../../gc_inst/user_projects/domains/GCDomain


Following log messages are populated when we try to access the OEM using LDAP user accounts….


[oracle@askmoem12c GCDomain]$ tail -f ldap_trace.logATN
17:31:47.729 ldc=6 Connected to ldaps://adauth.askmlabs.com:389
17:31:47.730 ldc=6 op=227 BindRequest {version=3, name=CN=oem.service,OU=Users,OU=Accounts,DC=askmlabs,DC=com, authentication=********}
17:31:47.732 ldc=6 op=227 BindResponse {resultCode=49, errorMessage=80090308: LdapErr: DSID-0C09042F, comment: AcceptSecurityContext error, data 532, v2580}
17:32:30.334 ldc=7 Connected to ldaps://adauth.askmlabs.com:389
17:32:30.334 ldc=7 op=228 BindRequest {version=3, name=CN=oem.service,OU=Users,OU=Accounts,DC=askmlabs,DC=com, authentication=********}
17:32:30.336 ldc=7 op=228 BindResponse {resultCode=49, errorMessage=80090308: LdapErr: DSID-0C09042F, comment: AcceptSecurityContext error, data 532, v2580}
17:35:00.485 ldc=8 Connected to ldaps://adauth.askmlabs.com:389
17:35:00.485 ldc=8 op=229 BindRequest {version=3, name=CN=oem.service,OU=Users,OU=Accounts,DC=askmlabs,DC=com, authentication=********}
17:35:00.487 ldc=8 op=229 BindResponse {resultCode=49, errorMessage=80090308: LdapErr: DSID-0C09042F, comment: AcceptSecurityContext error, data 532, v2580}
17:37:06.171 ldc=9 Connected to ldaps://adauth.askmlabs.com:389
17:37:06.171 ldc=9 op=230 BindRequest {version=3, name=CN=oem.service,OU=Users,OU=Accounts,DC=askmlabs,DC=com, authentication=********}
17:37:06.174 ldc=9 op=230 BindResponse {resultCode=49, errorMessage=80090308: LdapErr: DSID-0C09042F, comment: AcceptSecurityContext error, data 532, v2580}
17:39:45.033 ldc=10 Connected to ldaps://adauth.askmlabs.com:389
17:39:45.033 ldc=10 op=231 BindRequest {version=3, name=CN=oem.service,OU=Users,OU=Accounts,DC=askmlabs,DC=com, authentication=********}
17:39:45.035 ldc=10 op=231 BindResponse {resultCode=49, errorMessage=80090308: LdapErr: DSID-0C09042F, comment: AcceptSecurityContext error, data 52e, v2580}
17:47:17.121 ldc=2 Connected to ldaps://adauth.askmlabs.com:389
17:47:17.122 ldc=2 op=223 BindRequest {version=3, name=CN=oem.service,OU=Users,OU=Accounts,DC=askmlabs,DC=com, authentication=********}
17:47:17.124 ldc=2 op=223 BindResponse {resultCode=49, errorMessage=80090308: LdapErr: DSID-0C09042F, comment: AcceptSecurityContext error, data 532, v2580}
^C


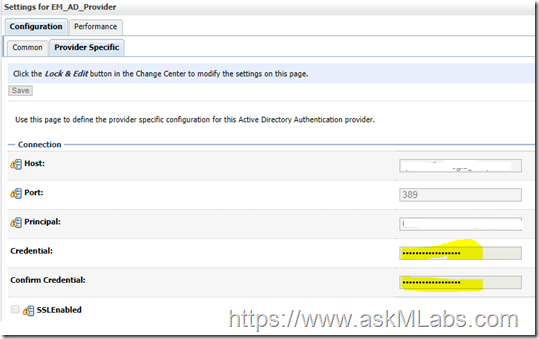
From the above error messages, the “resultCode=49” indicates that the bad password is used. Now we understand that the issue is to deal with the service account password. We changed the service account oem.service password and then updated the password in weblogic console as shown below.


Follow the navigation to update the password ….

Domain - > Environment - > Security Realms - > myrealm - > providers

image

image

image

image


Save the password. And then activate the changes.


Ideally we don’t  need to bounce the services to take these changes effect. But if you could offer the bounce, please bounce the complete OEM services.


Hope this information helps….

ACFS Mount Missing On Exadata - ACFS-02017 , CLSU-00101

This post talks about an Exadata RAC ASM issue. This issue is observed after completing Exadata patching.  It is observed that the ACFS mount point is missing. The following steps explains how we identified the issue and How can we troubleshoot this issue.

This is a 8 node Exadata full rack. The ACFS mount point is missing on first node , but all other 7 nodes have this ASM mount point.


First try to get the missing mount point …

Use “df –h” on any node where you can see the ACFS mount point. In our case getting the ACFS mount point details from node2 exaaskmdb02


[root@exaaskmdb02 ~]# df -h /u01/app/askmacfs
Filesystem            Size  Used Avail Use% Mounted on
/dev/asm/askmdata-282  512G   64G  449G  13% /u01/app/askmacfs
[root@exaaskmdb01 ~]#


Check1 :

Using these details, try to manually mount the ACFS on node1 exaaskmdb01


[root@exaaskmdb01 ~]# mount -t acfs /dev/asm/askmdata-282  /u01/app/askmacfs
mount.acfs: CLSU-00100: operating system function: open64 failed with error data: 2
mount.acfs: CLSU-00101: operating system error message: No such file or directory
mount.acfs: CLSU-00103: error location: OOF_1
mount.acfs: CLSU-00104: additional error information: open64 (/dev/asm/askmdata-282)
mount.acfs: ACFS-02017: Failed to open volume /dev/asm/askmdata-282. Verify the volume exists.
[root@exaaskmdb01 ~]#


We are not able to mount the ACFS mountpoint. The first approach for any troubleshooting is to analyze the error messages. Cetain times, there could be useful error messages, which can directly help to point to the issue. But sometimes, the error messages may not help to focus on the real issue , rather informational messages. Your experience will count a lot in these scenarios where you should be able to relate the error message to the issue.


Check2:

The error message which caught to our attention is “No such file or directory”. Now our next check will be to check the directories…

On exaaskmdb01 check the directories  /dev/asm/askmdata-282 and /u01/app/askmacfs

[root@exaaskmdb01 ]# ls -lrt /dev/asm/askmdata-282
ls: cannot access /dev/asm/askmdata-282: No such file or directory

[root@exaaskmdb01 ]# ls -ld /u01/app/askmacfs
drwxrwxr-x 11 grid oinstall 4096 May  9 12:00 /u01/app/askmacfs


Same thing, verify on any other node ( 2-8)

[root@exaaskmdb02 ]# ls -lrt /dev/asm/askmdata-282
brwxrwx--- 1 root asmadmin 248, 144385 Sep 12 15:33 /dev/asm/askmdata-282

[root@exaaskmdb02 ]# ls -ld /u01/app/askmacfs
drwxrwxr-x 11 grid oinstall 4096 May  9 12:00 /u01/app/askmacfs


From the above check, it is clear that node1 exaaskmdb01 is missing a directory. Now lets check further how to bring this directory. As these are ACFS mounts, there could be possibility that these are missing due to ACFS drivers not loading properly during node reboot. Let’s concentrate on the ACFS drivers….


Check3:

Check acfs modules to be loaded …

[root@exaaskmdb01 ~]# lsmod | grep oracle
oracleacfs           4825088  0
oracleadvm            806912  3
oracleoks             659456  2 oracleacfs,oracleadvm


This check looks good, the acfs drivers are loaded properly. The next check would be to check the ACFS volume informaiton.

Check4:

ASMCMD> volinfo --all
Diskgroup Name: ASKM_DG

         Volume Name: ASKMDATA
          Volume Device: /dev/asm/askmdata-282
          State: DISABLED                               <<<< Check this. This volume is disabled.
          Size (MB): 524288
          Resize Unit (MB): 64
          Redundancy: MIRROR
          Stripe Columns: 8
          Stripe Width (K): 1024
          Usage: ACFS
          Mountpath: /u01/app/askmacfs


From the above output, we get that the volume is disabled. Now let’s check the same thing on the other nodes exaaskmdb02-08


[grid@exaaskmdb02 ~]$ asmcmd
ASMCMD> volinfo --all
Diskgroup Name: ASKM_DG

         Volume Name: ASKMDATA
          Volume Device: /dev/asm/askmdata-282
          State: ENABLED                     <<< It is enabled on node2
          Size (MB): 524288
          Resize Unit (MB): 64
          Redundancy: MIRROR
          Stripe Columns: 8
          Stripe Width (K): 1024
          Usage: ACFS
          Mountpath: /u01/app/askmacfs


From the above check4, we understood that this is due to the reason that the volume is not enabled by default after patching. Now we need to enable this volume and mount this ACFS manually.


Solution

ASMCMD> volenable -G ASKM_DG -a
ASMCMD> volinfo --all
Diskgroup Name: ASKM_DG

         Volume Name: ASKMDATA
          Volume Device: /dev/asm/askmdata-282
          State: ENABLED
          Size (MB): 524288
          Resize Unit (MB): 64
          Redundancy: MIRROR
          Stripe Columns: 8
          Stripe Width (K): 1024
          Usage: ACFS
          Mountpath: /u01/app/askmacfs

ASMCMD> exit
[grid@exaaskmdb01 ~]$ ls -lrt /dev/asm/askmdata-282
brwxrwx--- 1 root asmadmin 248, 144385 Sep 12 15:56 /dev/asm/askmdata-282

[root@exaaskmdb01 ~]# ls -ld /u01/app/askmacfs
drwxrwxr-x 2 grid oinstall 4096 Mar 18  2016 /u01/app/askmacfs

[root@exaaskmdb01 ~]# mount -t acfs /dev/asm/askmdata-282 /u01/app/askmacfs

[root@exaaskmdb01 ~]# df -h /u01/app/askmacfs
Filesystem            Size  Used Avail Use% Mounted on
/dev/asm/askmdata-282  512G   64G  449G  13% /u01/app/askmacfs
[root@exaaskmdb01 ~]#


That’s it. We fixed the issue.


Questions to the readers

Q1) Where do you find the ASM related modules/drivers on Linux OS ?

Q2) What to do if you find any missing ASM modules/drivers on Linux OS ?

Q3) How to load the asm drivers if they were not loaded by default during node reboot ?


Refer to my other post <Place Holder> which is similar to this issue , but happened during our exa grid upgrade from 12.1.0.2 to 12.2.0.1.


Hope this information helps….

SCAN LISTENER TRACING

Written By askMLabs on Thursday, May 12, 2011 | 6:42 PM

This article describes enabling and disabling the SCAN listener tracing. Before capturing the scan listener tracing,please make sure your scan listener is configured as per the following Oracle Support IDs.
1070607.1
975457.1

Some where you should find some clue for your SCAN connectivity issues. If you are still unable to find the exact problem with the scan connectivity, you need to enable the tracing and analyze the trace files or upload the trace files to oracle support.

To enable level 16 tracing for SCAN listeners, add the following parameters to listener.ora and  try to reproduce the connectivity issue.

TRACE_LEVEL_<listener_name> = 16
TRACE_DIRECTORY_<listener_name> =<dir location>
TRACE_TIMESTAMP_<listener_name> = TRUE
DIAG_ADR_ENABLED_<listenername>=off

Then try to reload all the listeners after these parameters are in place using lsnrctl reload <listener_name>.

Reproduce the issue and verify that the trace and log files are created in the directory mentioned in the parameter TRACE_DIRECTORY_<listener_name>.

To disable scan listener tracing:

$lsnrctl
LSNRCTL>set current_listener <listener_name>
LSNRCTL>set trc_level OFF
LSNRCTL>save_config

In the above tracing we disabled diagnostic repository with the parameter DIAG_ADR_ENABLED_<listenername> and collected trace files. Now if you want to re-enable DIAG_ADR, just comment out DIAG_ADR_ENABLED_<listenername> in listener.ora and reload all the listeners.

NOTE: ADR is the new concept introduced from 11g and it is a file system repository to store all diagnostic data. Please review the article  Automatic Diagnostic Repository  to know more on ADR concepts.

Session Log to show enabling SCAN Tracing:

[grid@b600e6tr01 admin]$ cp listener.ora listener.ora_bak
[grid@b600e6tr01 admin]$ vi listener.ora   ==> Here add trace parameter
[grid@b600e6tr01 admin]$ clear
[grid@b600e6tr01 admin]$ ps -ef | grep -i tns
grid      5943  4623  0 07:12 pts/1    00:00:00 grep -i tns
grid     18139     1  0 May03 ?        00:01:01 /u01/home/11.2.0/grid/bin/tnslsnr LISTENER -inherit
grid     18142     1  0 May03 ?        00:01:14 /u01/home/11.2.0/grid/bin/tnslsnr LISTENER_SCAN2 -inherit
grid     18164     1  0 May03 ?        00:01:18 /u01/home/11.2.0/grid/bin/tnslsnr LISTENER_SCAN3 -inherit
[grid@b600e6tr01 admin]$ lsnrctl reload listener
LSNRCTL for Linux: Version 11.2.0.1.0 - Production on 04-MAY-2011 07:12:38
Copyright (c) 1991, 2009, Oracle.  All rights reserved.
Connecting to (DESCRIPTION=(ADDRESS=(PROTOCOL=IPC)(KEY=LISTENER)))
The command completed successfully
[grid@b600e6tr01 admin]$ lsnrctl reload LISTENER_SCAN2
LSNRCTL for Linux: Version 11.2.0.1.0 - Production on 04-MAY-2011 07:12:55
Copyright (c) 1991, 2009, Oracle.  All rights reserved.
Connecting to (DESCRIPTION=(ADDRESS=(PROTOCOL=IPC)(KEY=LISTENER_SCAN2)))
The command completed successfully
[grid@b600e6tr01 admin]$ lsnrctl reload LISTENER_SCAN3
LSNRCTL for Linux: Version 11.2.0.1.0 - Production on 04-MAY-2011 07:13:02
Copyright (c) 1991, 2009, Oracle.  All rights reserved.
Connecting to (DESCRIPTION=(ADDRESS=(PROTOCOL=IPC)(KEY=LISTENER_SCAN3)))
The command completed successfully
[grid@b600e6tr01 admin]$
[grid@b600e6tr02 admin]$ cp listener.ora listener.ora_bak
[grid@b600e6tr02 admin]$ vi listener.ora  ==> Here add trace parameters
[grid@b600e6tr02 ~]$ ps -ef | grep -i tns
grid      1042     1  0 May03 ?        00:01:20 /u01/home/11.2.0/grid/bin/tnslsnr LISTENER_SCAN1 -inherit
grid      1171     1  0 May03 ?        00:01:04 /u01/home/11.2.0/grid/bin/tnslsnr LISTENER -inherit
grid      8231  7935  0 07:06 pts/1    00:00:00 grep -i tns
[grid@b600e6tr02 ~]
[grid@b600e6tr02 admin]$ lsnrctl reload LISTENER
LSNRCTL for Linux: Version 11.2.0.1.0 - Production on 04-MAY-2011 07:13:26
Copyright (c) 1991, 2009, Oracle.  All rights reserved.
Connecting to (DESCRIPTION=(ADDRESS=(PROTOCOL=IPC)(KEY=LISTENER)))
The command completed successfully
[grid@b600e6tr02 admin]$ lsnrctl reload LISTENER_SCAN1
LSNRCTL for Linux: Version 11.2.0.1.0 - Production on 04-MAY-2011 07:13:35
Copyright (c) 1991, 2009, Oracle.  All rights reserved.
Connecting to (DESCRIPTION=(ADDRESS=(PROTOCOL=IPC)(KEY=LISTENER_SCAN1)))
The command completed successfully
[grid@b600e6tr02 admin]$

Session Log to show disabling SCAN Tracing:

[grid@b600e6tr01 ~]$ ps -ef | grep -i tns
grid      5309  4623  0 07:06 pts/1    00:00:00 grep -i tns
grid     18139     1  0 May03 ?        00:01:01 /u01/home/11.2.0/grid/bin/tnslsnr LISTENER -inherit
grid     18142     1  0 May03 ?        00:01:14 /u01/home/11.2.0/grid/bin/tnslsnr LISTENER_SCAN2 -inherit
grid     18164     1  0 May03 ?        00:01:18 /u01/home/11.2.0/grid/bin/tnslsnr LISTENER_SCAN3 -inherit
[grid@b600e6tr01 ~]$ lsnrctl
LSNRCTL for Linux: Version 11.2.0.1.0 - Production on 04-MAY-2011 07:07:02
Copyright (c) 1991, 2009, Oracle.  All rights reserved.
Welcome to LSNRCTL, type "help" for information.
LSNRCTL> set current_listener LISTENER
Current Listener is LISTENER
LSNRCTL> set trc_level OFF
Connecting to (DESCRIPTION=(ADDRESS=(PROTOCOL=IPC)(KEY=LISTENER)))
LISTENER parameter "trc_level" set to off
The command completed successfully
LSNRCTL> save_config
Connecting to (DESCRIPTION=(ADDRESS=(PROTOCOL=IPC)(KEY=LISTENER)))
Saved LISTENER configuration parameters.
Listener Parameter File   /u01/home/11.2.0/grid/network/admin/listener.ora
Old Parameter File   /u01/home/11.2.0/grid/network/admin/listener.bak
The command completed successfully
LSNRCTL> set current_listener LISTENER_SCAN2
Current Listener is LISTENER_SCAN2
LSNRCTL> set trc_level OFF
Connecting to (DESCRIPTION=(ADDRESS=(PROTOCOL=IPC)(KEY=LISTENER_SCAN2)))
LISTENER_SCAN2 parameter "trc_level" set to off
The command completed successfully
LSNRCTL> save_config
Connecting to (DESCRIPTION=(ADDRESS=(PROTOCOL=IPC)(KEY=LISTENER_SCAN2)))
Saved LISTENER_SCAN2 configuration parameters.
Listener Parameter File   /u01/home/11.2.0/grid/network/admin/listener.ora
Old Parameter File   /u01/home/11.2.0/grid/network/admin/listener.bak
The command completed successfully
LSNRCTL> set current_listener LISTENER_SCAN3
Current Listener is LISTENER_SCAN3
LSNRCTL> set trc_level OFF
Connecting to (DESCRIPTION=(ADDRESS=(PROTOCOL=IPC)(KEY=LISTENER_SCAN3)))
LISTENER_SCAN3 parameter "trc_level" set to off
The command completed successfully
LSNRCTL> save_config
Connecting to (DESCRIPTION=(ADDRESS=(PROTOCOL=IPC)(KEY=LISTENER_SCAN3)))
Saved LISTENER_SCAN3 configuration parameters.
Listener Parameter File   /u01/home/11.2.0/grid/network/admin/listener.ora
Old Parameter File   /u01/home/11.2.0/grid/network/admin/listener.bak
The command completed successfully
LSNRCTL>
[grid@b600e6tr02 ~]$ ps -ef | grep -i tns
grid      1042     1  0 May03 ?        00:01:20 /u01/home/11.2.0/grid/bin/tnslsnr LISTENER_SCAN1 -inherit
grid      1171     1  0 May03 ?        00:01:04 /u01/home/11.2.0/grid/bin/tnslsnr LISTENER -inherit
grid      8231  7935  0 07:06 pts/1    00:00:00 grep -i tns
[grid@b600e6tr02 ~]$ lsnrctl
LSNRCTL for Linux: Version 11.2.0.1.0 - Production on 04-MAY-2011 07:10:37
Copyright (c) 1991, 2009, Oracle.  All rights reserved.
Welcome to LSNRCTL, type "help" for information.
LSNRCTL> set current_listener LISTENER
Current Listener is LISTENER
LSNRCTL> set trc_level OFF
Connecting to (DESCRIPTION=(ADDRESS=(PROTOCOL=IPC)(KEY=LISTENER)))
LISTENER parameter "trc_level" set to off
The command completed successfully
LSNRCTL> save_config
Connecting to (DESCRIPTION=(ADDRESS=(PROTOCOL=IPC)(KEY=LISTENER)))
Saved LISTENER configuration parameters.
Listener Parameter File   /u01/home/11.2.0/grid/network/admin/listener.ora
Old Parameter File   /u01/home/11.2.0/grid/network/admin/listener.bak
The command completed successfully
LSNRCTL> set current_listener LISTENER_SCAN1
Current Listener is LISTENER_SCAN1
LSNRCTL> set trc_level OFF
Connecting to (DESCRIPTION=(ADDRESS=(PROTOCOL=IPC)(KEY=LISTENER_SCAN1)))
LISTENER_SCAN1 parameter "trc_level" set to off
The command completed successfully
LSNRCTL> save_config
Connecting to (DESCRIPTION=(ADDRESS=(PROTOCOL=IPC)(KEY=LISTENER_SCAN1)))
Saved LISTENER_SCAN1 configuration parameters.
Listener Parameter File   /u01/home/11.2.0/grid/network/admin/listener.ora
Old Parameter File   /u01/home/11.2.0/grid/network/admin/listener.bak
The command completed successfully
LSNRCTL>

Hope it helps
SRI

R12 - How to enable logging for Apache,Oc4j and Opmn

Written By askMLabs on Tuesday, September 29, 2009 | 7:51 AM

R12 - How to enable logging for Apache,Oc4j and Opmn:


Apache Logging ( Plain Text )
==============================

1) Edit the file $ORA_CONFIG_HOME/10.1.3/Apache/Apache/conf/httpd.conf and set
LogLevel warn (s_apache_loglevel in context file)
2) Bounce the apache
3) Try to access the home URL or reproduce the issue.
4) Collect the following logfiles from $LOG_HOME/ora/10.1.3/Apache
access_log.<unique id>
error_log.<unique id>

Values that can be set to LogLevel variable in httpd.conf file
LogLevel = emerg,alert,crit,error,warn,notice,info,debug.

Apache Logging ( ODL Logging)
=============================

1) Set the following parameters in file $ORA_CONFIG_HOME/10.1.3/Apache/Apache/conf/httpd.conf
OraLogMode [oracle|odl|apache]
OraLogSeverity <message type>:<message level>

Message type: INTERNAL_ERROR, ERROR, WARNING, NOTIFICATION & TRACE
Message level: 1-32 (1 most severe, 32 least)
2) Bounce the apache
3) Try to access the home URL or reproduce the issue.
4) Collect the logfiles from $LOG_HOME/ora/10.1.3/Apache/oracle

OC4J Logging
============

By default Oracle Applications R12 creates 3 OC4J instances:
*  OACore: runs OA Framework-based applications
* Forms: runs Forms-base applications
* OAFM (Oracle Apps Fusion Middleware): runs web services, mapviewer, ascontrol

Loglevel is set in the file
$ORA_CONFIG_HOME/10.1.3/j2ee/<oacore, forms, oafm>/config

Log file path is specified in the file
$ORA_CONFIG_HOME/10.1.3/j2ee/<oacore, forms, oafm>/application-deployments/<oacore, forms, oafm>/orion-application.xml

1) Open the file to set the following log level $ORA_CONFIG_HOME/10.1.3/j2ee/<oacore, forms, oafm>/config/j2ee-logging.xml
2) Come to the location located as
"<logger name='oracle' level='NOTIFICATION:1‘ .....
3) Set the desired logging using following values
<message type>:<message level>
Message type: INTERNAL_ERROR, ERROR, WARNING, NOTIFICATION & TRACE
Message level: 1-32 (1 most severe, 32 least)
4) Locate the log file path from the file
$ORA_CONFIG_HOME/10.1.3/j2ee/<oacore, forms, oafm>/application-deployments/<oacore,forms,oafm>/orion-application.xml
(Will be identified with tag : <log> <file path=...> </log>)
5) Bounce the OC4J instance and reproduce the issue
6) Collect the log files from the following locations .
Plain text -> $LOG_HOME/ora/10.1.3/j2ee/<oacore, forms, oafm>/<oacore,forms,oafm>_<default_group_1>/application.log
ODL Log -> $LOG_HOME/ora/10.1.3/j2ee/<oacore, forms, oafm>/<oacore,forms,oafm>_<default_group_1>/log.xml

OPMN Logging
============

1) Open the file $ORA_CONFIG_HOME/10.1.3/opmn/conf/opmn.xml to set the logging parameter
2) Logging is enabled per component (internal, ons or pm)
3) Levels that can be set are (component codes) as following:
none, fatal, error, warn, notify          (written to .log)
debug1, debug2, debug3, debug4    (written to .dbg)
Ex :
opmnctl set target=log comp=warn
opmnctl set target=debug comp=debug1
4) Bounce opmn services and reproduce the issue
5) Collect the opmn log files generated in $LOG_HOME/ora/10.1.3/opmn
opmn.log , opmn.dbg and opmn.out

NOTE : Logfiles can be enabled for rotation using parameter s_opmn_log_rotation_size, s_opmn_log_rotation_time in opmn.xml

Various Other Logfiles :
========================

$LOG_HOME/appl/admin/log/


ServiceLogfile Name
TNS Listener Start/Stop logadalnctl.txt
Fulfillment Server Start/Stop logjtffmctl.txt
Oracle HTTP Server start/stop logadapcctl.txt
Concurrent Managers and ICM start/stop logadcmctl.txt
Forms OC4J start/stop logadformsctl.txt
OACore OC4J start/stop logadoacorectl.txtq
OAFM OC4J start/stop logadoafmctl.txt
OPMN start/stop logadopmnctl.txt

R12 - Concurrent Program Tracing

Written By askMLabs on Friday, September 25, 2009 | 7:46 AM

Concurrent Program Tracing :

Reference Note : 296559.1

CASE 1 : Concurrent Program Tracing without bind variables
1) Follow the following navigation to enable logging for conc prog
Goto Sysadmin > Concurrent > Program > Define
Query the concurrent program
Check the trace box to enable trace
2) Execute the concurrent program using the following navigation and note down the request id
3) Collect the trace file using the script provided here

CASE 2: Concurrent Program Tracing with bind variables and waits
1) Note down the following values
SELECT value FROM v$parameter WHERE name = 'max_dump_file_size';
SELECT value FROM v$parameter WHERE name = 'timed_statistics';

2) Execute the following commands as sysdba
ALTER SYSTEM SET max_dump_file_size = unlimited;
ALTER SYSTEM SET timed_statistics = true;
ALTER SYSTEM SET EVENTS '10046 trace name context forever, level 12';

3) Execute the concurrent program using the following navigation and note down the request id
4) Collect the trace file using the script provided here
5) Turn off tracing the reset the values
ALTER SYSTEM SET EVENTS '10046 trace name context off';
ALTER SYSTEM SET max_dump_file_size = <value from step 1>;
ALTER SYSTEM SET timed_statistics = <value from step 1>;

CASE 3:
Enabling the trace for a concurrent request for which you donot have privileges to run the concurrent Request.

1) Ask the person who is privileged to run the concurrent program and get the request id 'xxxxx'
2) Get the oracle_process_id for that concurrent request.
SQL>select request_id,oracle_process_id from fnd_concurrent_requests where request_id in ('xxxxxxx');

3) Now get the session details ( SID and Serial ) using value obtained from step 2
col "SID/SERIAL" format a10
col username format a15
col osuser format a15
col program format a40
select s.sid || ',' || s.serial# "SID/SERIAL"
, s.username
, s.osuser
, s.status
, p.spid "OS PID"
, s.inst_id
, s.module
from sys.gv_$session s
, sys.gv_$process p
Where s.paddr = p.addr
and s.inst_id = p.inst_id
and p.spid=&value_from_step2
order by to_number(p.spid);

4) Execute the following command to enable the trace :
SQL> EXECUTE dbms_support.start_trace_in_session (&SID,&SERIAL,binds=>true,waits=>true);

NOTE : You need to run this command on the corresponding rac node, inst_id from step3)
5) Collect the trace from udump location and investigate the issue.

FRD - Forms Runtime Diagnostics

Written By askMLabs on Sunday, September 20, 2009 | 4:19 PM

How To Collect And Use Forms Trace (FRD) in Oracle Applications Release 12:

Forms Runtime Diagnostics (FRD) :


It is a method used to capture all the events that occur in a form session. It is a combination of external user-application interactions and internal Forms processing events.

FRD can be activated in 3 ways ......

  1. Using profile option

  2. Using appsweb.cfg

  3. In an ADHOC way

Action steps for "Using Profile Option" :
1) Login to application as sysadmin user
2) Note the profile value for "ICX: Forms Launcher" at site level
3) Change the profile value for "ICX: Forms Launcher" at user level
 http://hostname.domain:port/forms/frmservlet?record=collect+log=frdtrace.log  --> In servlet mode

 http://hostname.domain:port/OA_HTML/frmservlet?record=collect+log=frdtrace.log --> In socket mode

4) Bounce the apache services
5) Login into Oracle Applications and launch forms via self-service
6) Collect the log file from location $FORMS_TRACE_DIR
NOTE : You can also use the profile "Forms Runtime parameters" to pass the run time parameters.

Action steps for "Using appsweb.cfg" :

1) Edit the appsweb.cfg file pointed by environment variable "FORMS_WEB_CONFIG_FILE"
 record=collect

 log=formstrace.log

Edit in  section with heading "ENVIRONMENT SPECIFIC PARAMETERS "
2) Bounce the apache services
3) Login into Oracle Applications and launch forms via self-service
4) Collect the log file from location $FORMS_TRACE_DIR

Action steps for "In an ADHOC way":

1) Access forms using following urls directly and collect the log files in $FORMS_TRACE_DIR

http://hostname.domain:port/forms/frmservlet?record=collect+log=frdtrace.log  --> In servlet mode
http://hostname.domain:port/OA_HTML/frmservlet?record=collect+log=frdtrace.log --> In socket mode

2) Collect the log files from $FORMS_TRACE_DIR

Forms Trace Diagnostics Utility :


Forms Trace allows you to record information about a precisely defined part of forms functionality or a class of user actions. It provides detailed data collection and other features to assist the user in diagnosing and investigating forms runtime problems. Additional to old FRD logging, forms trace promises to have more structured logging with additional event which can be traced.

Action Steps
============

1) Edit the appsweb.cfg file pointed by environment variable "FORMS_WEB_CONFIG_FILE"
 record=collect

 tracegroup=medium

Edit in  section with heading "ENVIRONMENT SPECIFIC PARAMETERS "

2) Bounce the apache services

3) Login into Oracle Applications and launch forms via self-service

4) Collect the trace file from location $FORMS_TRACE_DIR and convert it either to xml or html file

With ADHOC
==========


1) Access forms using following urls directly and collect the log files in $FORMS_TRACE_DIR
 http://hostname.domain:port/forms/frmservlet?record=forms tracegroup=full  --> In servlet mode

 http://hostname.domain:port/OA_HTML/frmservlet?record=forms tracegroup=full --> In socket mode

2) Collect the trace file from location $FORMS_TRACE_DIR and convert it either to xml or html file

Converting the forms trace file to xml or html format  .....

To convert the binary file into XML format:

<JDK_HOME>/bin/java -cp <10.1.2 ORACLE_HOME>/forms/java/frmxlate.jar
oracle.forms.diagnostics.Xlate datafile=$1.trc outputfile=$1.xml outputclass=WriteOut

To convert the binary file into HTML format:

<JDK_HOME>/bin/java -cp <10.1.2 ORACLE_HOME>/forms/java/frmxlate.jar
oracle.forms.diagnostics.Xlate datafile=$1.trc outputfile=$1.html outputclass=WriteOutHTML

Ref : Note 373548.1

Servlet Logging
===============

1) Edit the appsweb.cfg file pointed by environment variable "FORMS_WEB_CONFIG_FILE"
 serverURL=/forms/lservlet/<parameter>

  Where parameter = /session or /sessionperf or /perf or /debug

2) Collect the log file :
$LOG_HOME/ora/10.1.3/j2ee/forms/forms_default_group_1/application.log
 
Support :
Copyright © 2013. askMLabs - All Rights Reserved
Proudly powered by Blogger